Efficiently managing Transport Graphs (TGs) is a crucial requirement of Transport-related Geographical Information Systems (GIS). A TG models a transport network as mathematical graph structure of vertices and edges. TGs may be used for route planning, transport analysis or travel time calculation. For efficiently managing TGs, a collection of software tools on top of a generic graph model is necessary: Generating graph structures from geographic data models, data import or export, data access, persistence, versioning, attribution, visualization or scalable data processing. With Graphium, we open-source our Java implementation of a software tool being capable of managing transport graphs in a generic and easy way. Graphium has been released under the Apache 2.0 license and may be freely used by software engineers, planners or researchers in the transport domain.
In the past, building a digital transport application or doing transport analyses often started with the following re-occurring questions: Which digital transport network should be used? How to design an appropriate transport graph model? How to import and convert the data into a GIS database? How to persist and access the data? How to handle graph updates as well as versioning? How to handle different attribute values? How to scale data processing?
Being annoyed by all these re-occurring preparatory steps, we started to implement a generic and easy to handle Java implementation being called Graphium. Since Graphium turned out to be a very powerful tool for our daily work, we decided to move it to GitHub and released it under an Apache 2.0 license.
What are the main features?
Graphium can be used as a standalone server for managing transport graphs of different origins. REST APIs allow for data import/export as well as easy data access. Graphium is designed for importing transport graph data from different data providers. The Graphium Import API expects the transport graph data in a specific JSON format. For creating such JSON files, a data provider’s specific data format has to be converted. Currently, Graphium supports converters for OpenStreetMap data and Austria’s GIP (Graph Integration Platform) – Austria’s joint, nationwide transport graph, both being released under an Open License.
Graphium uses a uniform transport data model. Transport graphs can be persisted using the relational database PostgreSQL (with PostGIS extension) or alternatively the graph database Neo4j. The internal data model contains all relevant attributes for describing a transport graph. For specific needs, the data model can be easily extended.
Regarding changes or updates, Graphium is designed to manage multiple versions of the same transport graph. Therefore, a particular version of a transport graph represents a digitized snapshot of a transport network within a defined timespan. Several versions of the same transport graph may exist in parallel in the database.
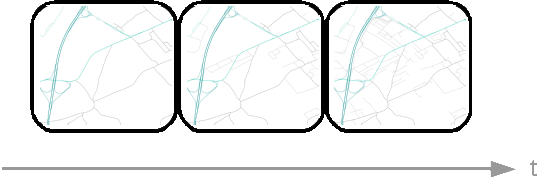
Graph versions evolve over time
For accessing transport graphs, REST APIs allow for requesting a whole graph or only specific edges. Graphium views allow requesting and processing filtered graphs with specific criteria. For example, three different views on a transport graph may be defined: (1) all roads without restrictions, (2) roads being accessible by cars and (3) roads being accessible by bike.

Graphium Satellite Servers integrated into a distributed system
Graphium is designed for being deployed in distributed systems allowing for horizontal scaling. A publish/subscribe mechanism enables the deployment of one central Graphium server managing the original transport graphs and versions. Several other Graphium servers, being called Graphium Satellites, are able to subscribe to specific graphs of the central server. If graph versions on the central server are updated, all subscribed satellite servers are informed of that update and are therefore able to ensure a consistent graph version state.
My experiences with Graphium
For me, as one of the Graphium’s main developers, this tool is very useful in my everyday work. On the one hand, a Graphium server runs locally on my workstation for development and analysis tasks. On the other hand, we use several distributed Graphium servers for map matching GPS trajectories (more information in an upcoming blog) in our productive Floating Car Data (FCD) system, where realtime traffic information is being calculated. We use the graph data from GIP, which provides an updated version of the graph every two months. To update the data in Graphium, I only have to download a GIP IDF file (which normally has a size of 4GB), convert and import it into a Graphium central server. Before the transition to Graphium, the import process took 3 to 4 hours because I had to import the graph data manually on each server. After refactoring the system and the integration of Graphium, I only have to import the graph data once and trigger the semi-automatic publishing process. This takes about only 15 minutes!
Interested?
![]()
If you want to give Graphium a try, go to GitHub to get Graphium: